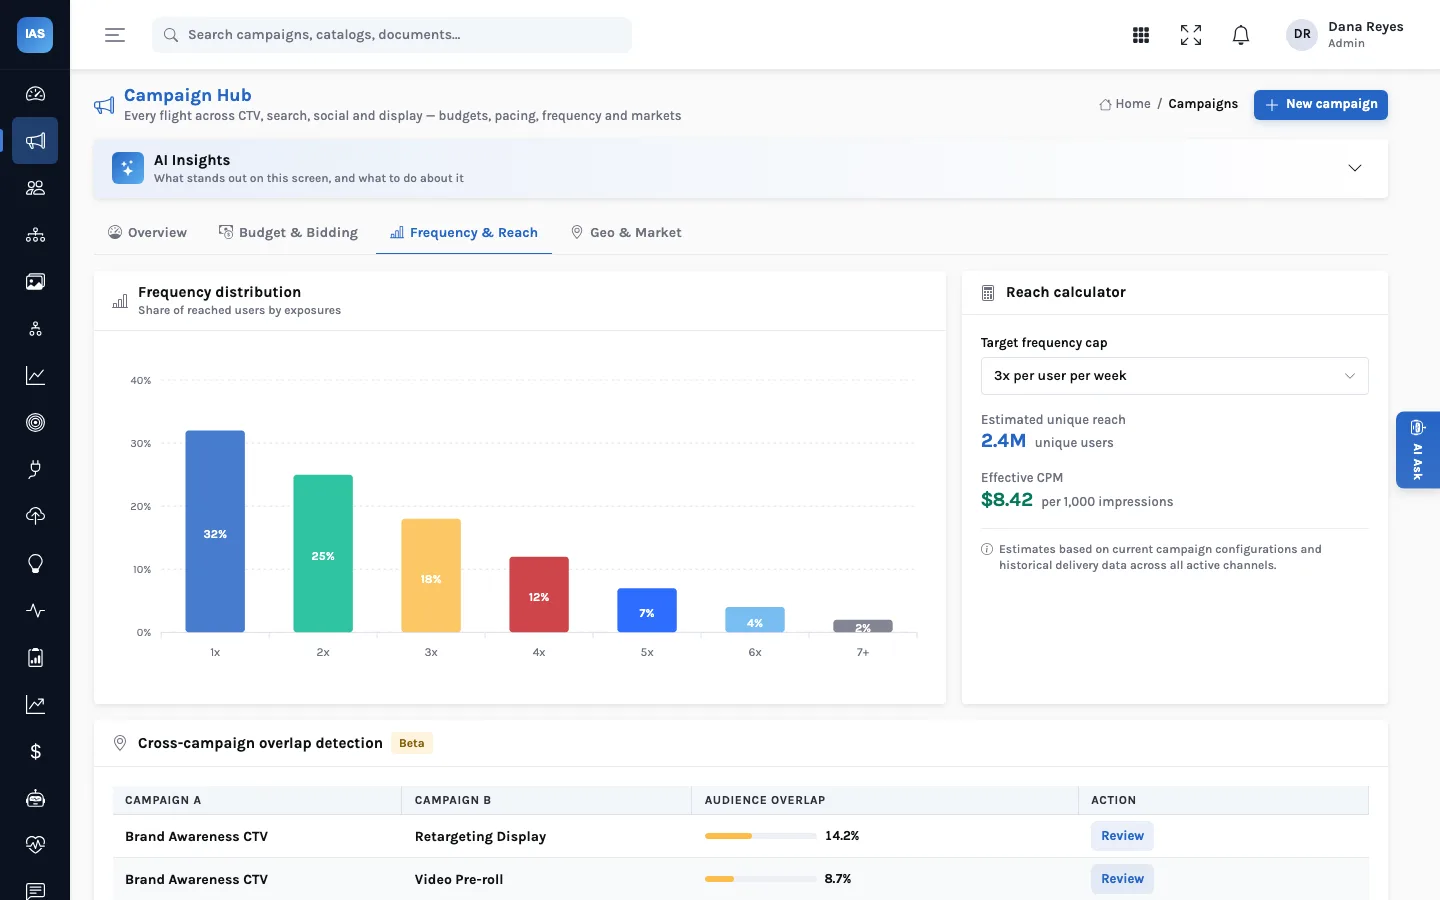
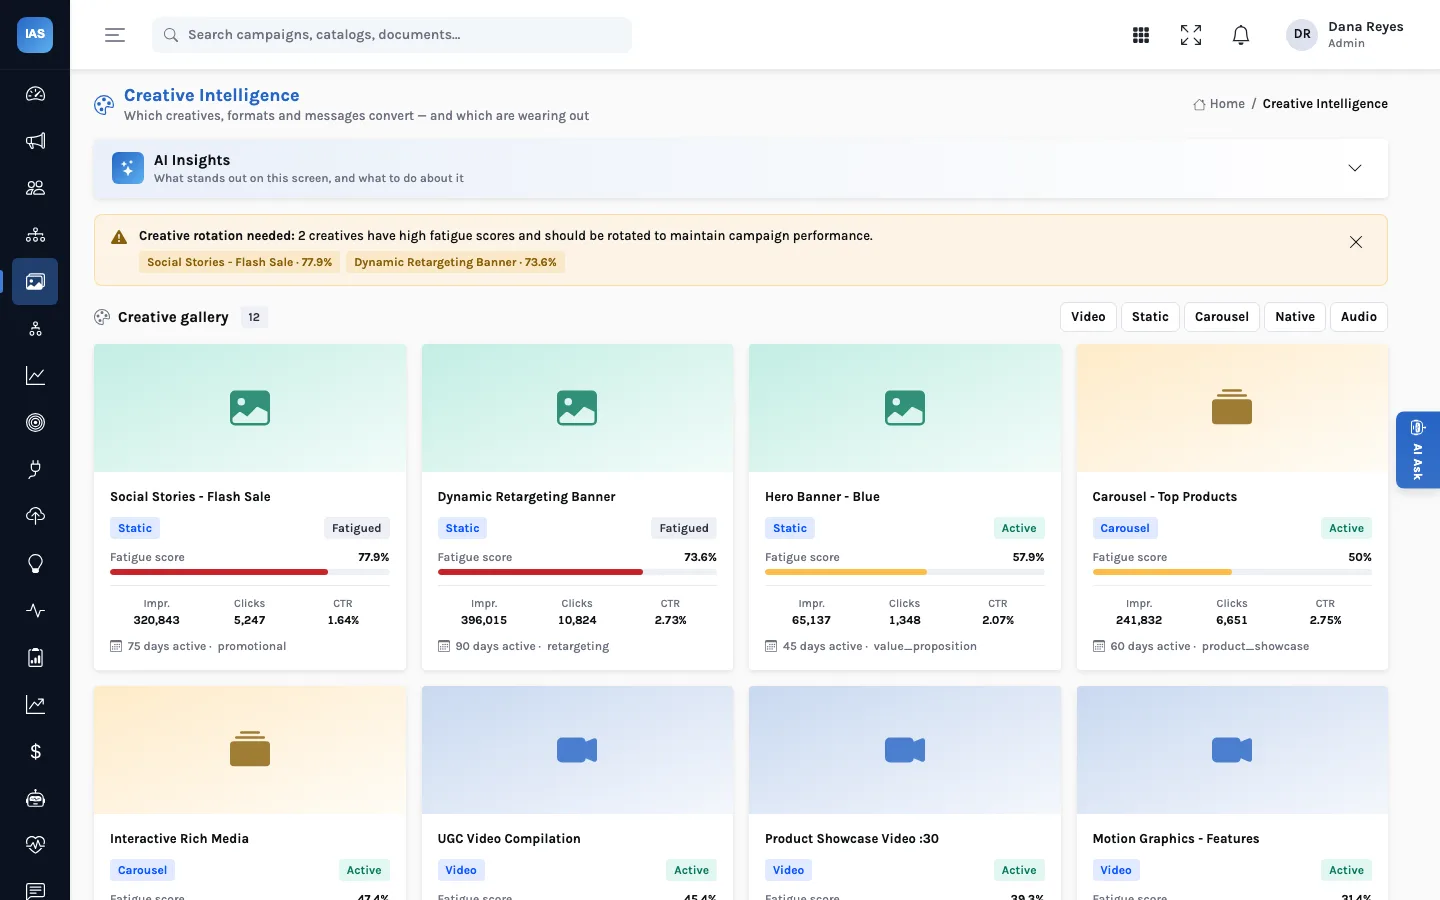
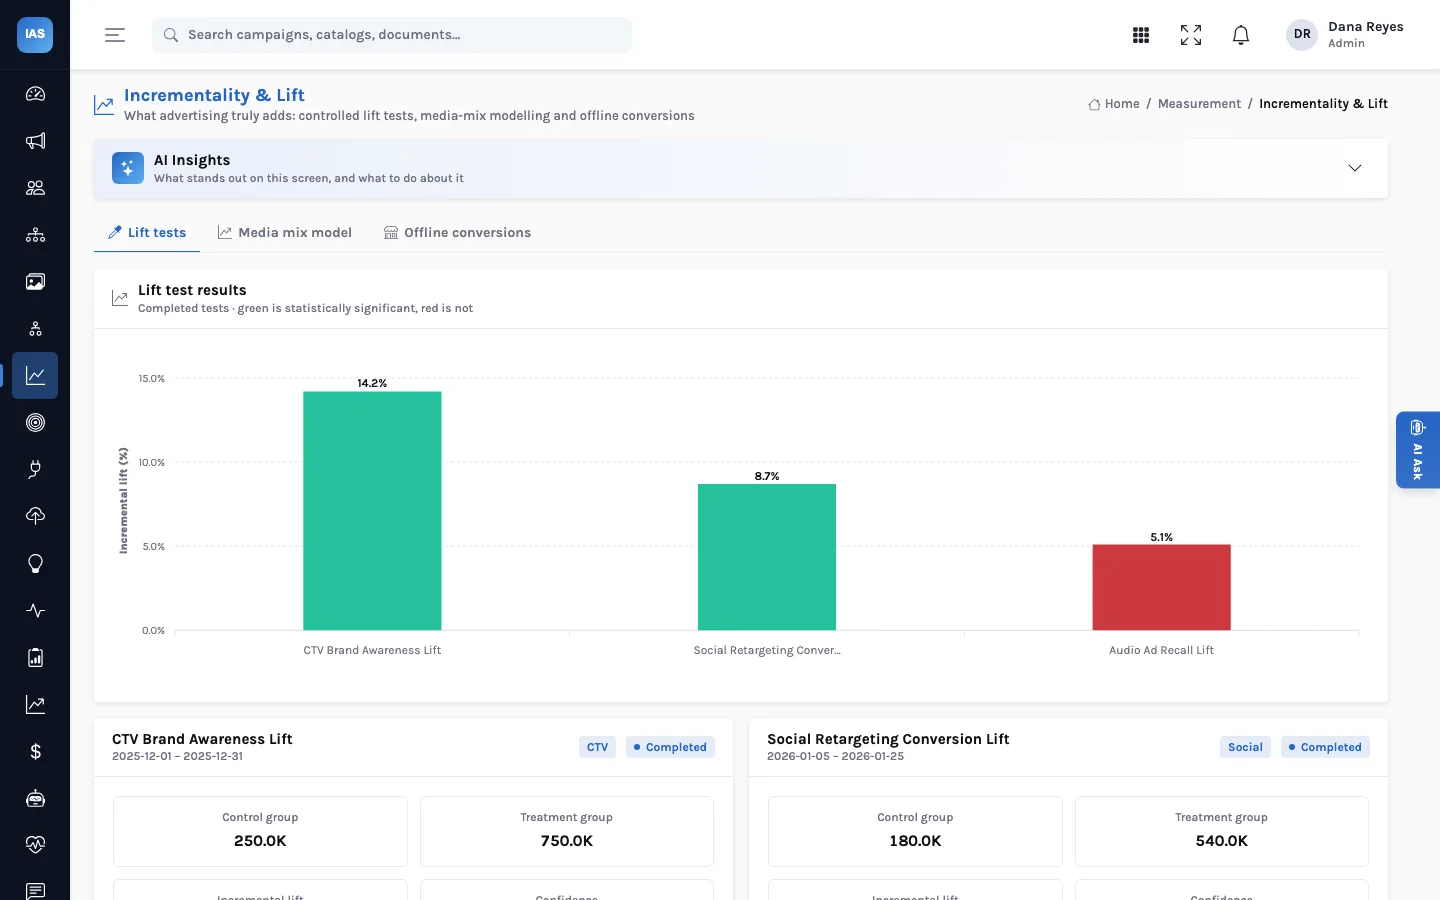
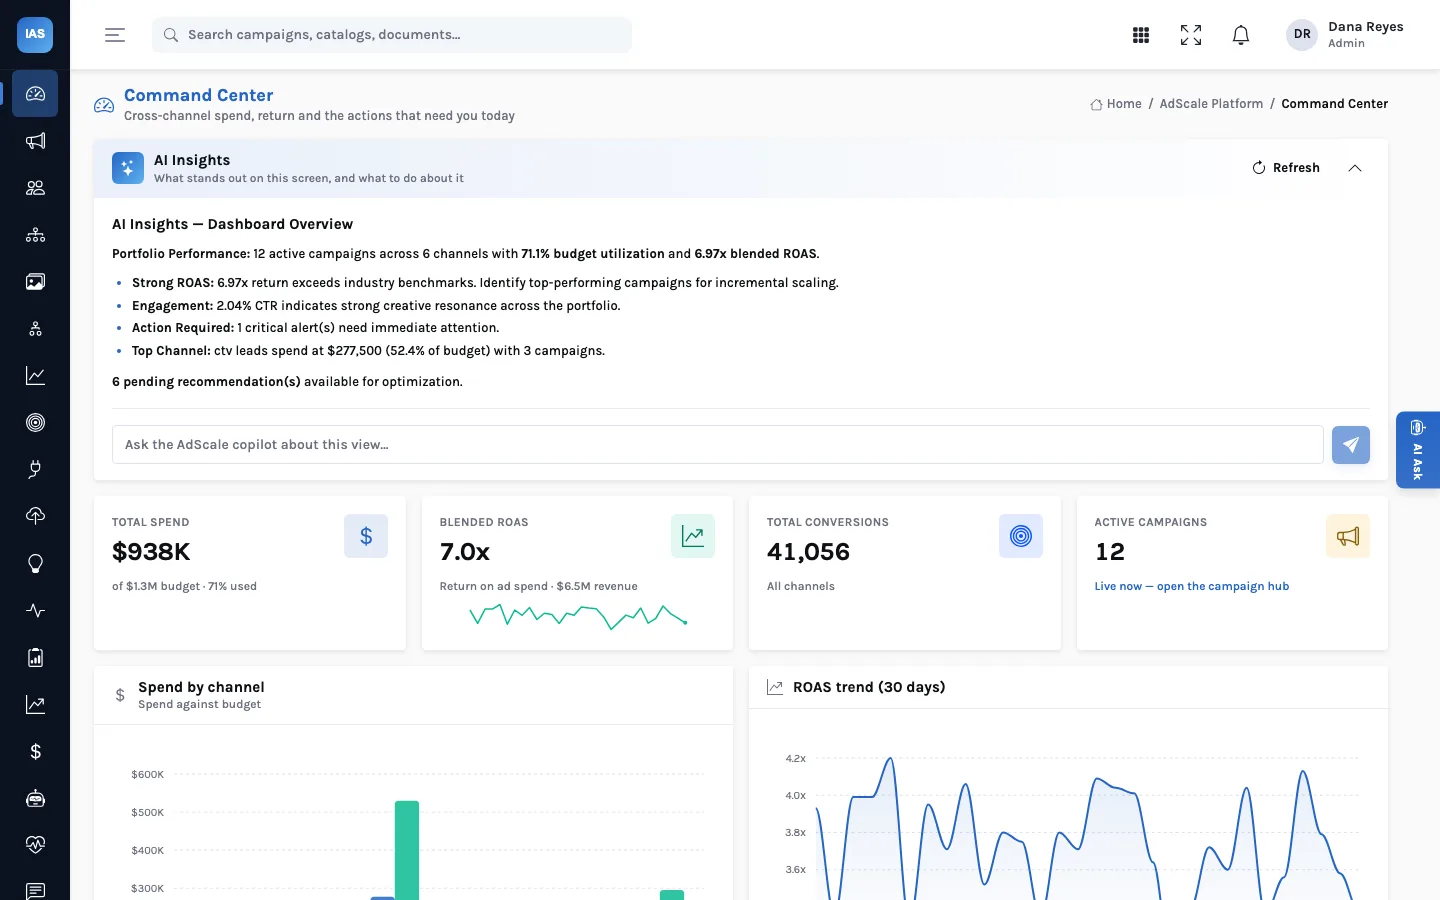
Every main screen in InsightAdScale opens with an AI Insights panel: "what stands out on this screen, and what to do about it." It is meant to save the first ten minutes of staring at a dashboard. Whether it is worth reading depends on one thing: what the summary is built from. This article explains exactly that.
The panel's summary is built from the same records the screen shows, gathered fresh when you open it. With a language model configured, the model writes the summary from that context; without one, a rule-based summary is written from the same numbers. Either way it streams into the panel, and a copilot box takes follow-up questions about the same view.
Step one: the context comes from the page
When the panel loads, InsightAdScale's AI service gathers the data behind the page you are on. On the Command Center that means portfolio totals: budget and spend, impressions, clicks and CTR, conversions and revenue, blended ROAS, alerts by severity, pending recommendations and spend by channel. On Campaigns it is every campaign grouped by channel, with status, budget, spend and pacing; on Creative, each creative's format, delivery and fatigue score; on Audiences, segments with their size, match rate, conversion rate and saturation risk; on Attribution, credit, conversions and revenue by model and channel. Screens without their own context, such as Recommendations or Diagnostics, use the Command Center's portfolio context. There is no separate AI copy of your data to drift out of date.
Step two: a model, or the rules
If the deployment has a language model configured, that context goes to the model with a short instruction: three to five specific, actionable points, with numbers, under two hundred words. If no model is configured, or the model call fails before it returns anything, InsightAdScale writes a rule-based summary from the same numbers instead: utilisation, the leading channel's share of spend, critical alerts, pending recommendations. You always get a summary; you get a richer one with a model.
What the rule-based summary checks
The rule-based summary is not a vague paragraph: it is a fixed set of checks, so you can predict what it will say. On the main screens it looks for the following.
| Screen | What it reports | When it adds a flag |
|---|---|---|
| Command Center | Active campaigns, number of channels, budget utilisation, blended ROAS | Utilisation above 90% or below 60%; ROAS above 3x or below 1.5x; CTR above 2% or below 0.5%; any critical alert; the channel with the most spend; pending recommendations |
| Campaigns | Each channel's campaigns, how many are active, and its utilisation | Campaigns that have spent more than 95% of budget |
| Creative | Creatives tracked and how many are fatigued | Fatigue score of 70 or more; creatives above 2% CTR |
| Audiences | Segments under management | High saturation risk; match rate below 50% |
| Attribution | Total attributed revenue and the number of models loaded | Prompts to compare last-touch with multi-touch credit |
Those thresholds are generic. A 1.5x return may be healthy for a brand-awareness portfolio and poor for direct response, which is why the summary is a starting point and not a verdict.
A worked example
Take a made-up portfolio: 18 active campaigns across six channels, 93% of budget spent, a blended ROAS of 2.4x, a CTR of 0.4%, one critical alert and five pending recommendations, with CTV taking the most spend. The rule-based summary would open with the portfolio line, then flag the budget (over 90%), the low CTR (under 0.5%), the critical alert and CTV as the top channel, and end by pointing at the five recommendations. It would say nothing about ROAS, because 2.4x sits between the two thresholds. A model-written summary of the same data might connect the points, for example asking whether the low CTR sits in the channel taking the most spend, and it should quote the same numbers.
Step three: ask a follow-up
Under the summary, a copilot box takes questions about the view: "which campaigns are pacing over 90%?", "what's driving the ROAS dip?". The copilot receives the same page context plus your question, so its answers are about the data on screen, not general advice. The AI Ask tab on the right edge opens the wider assistant for questions that span screens.
Where the panel helps most
- Monday triage. Read the Command Center summary first, then open the two or three things it flags. It is a faster first pass than scanning every chart.
- Hand-offs. A summary written from the numbers is a good starting point for the weekly note to a client or a manager. Edit it; don't paste it blind.
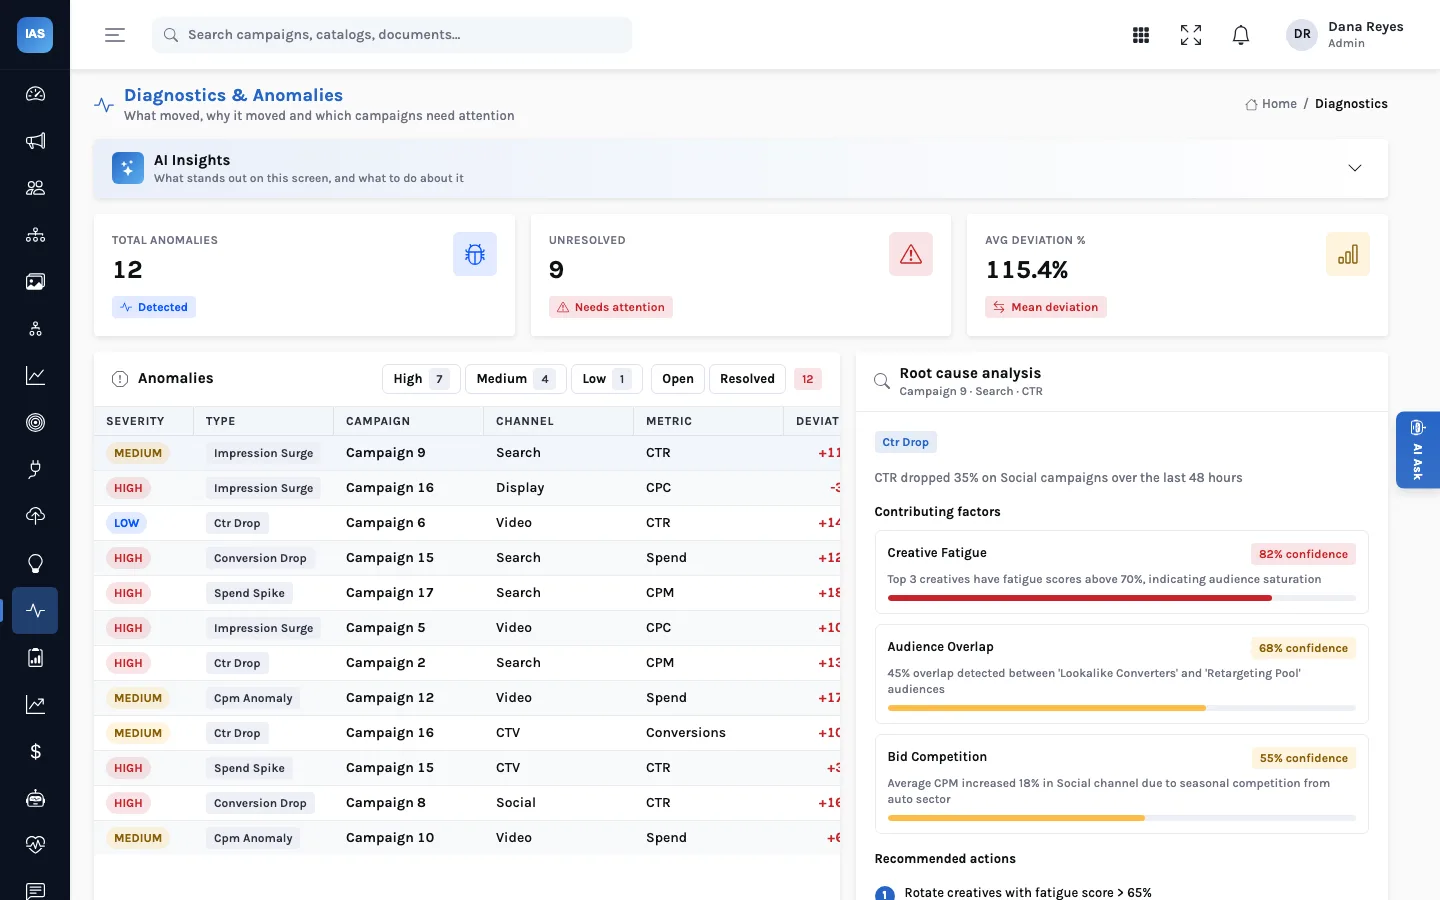
- Diagnostics. On the Diagnostics screen, anomalies sit next to a root-cause view with contributing factors, each with a confidence, and recommended actions. The AI panel there currently summarises the portfolio, so read it alongside the anomaly table rather than instead of it.
Using it well
- Check the numbers it quotes. They come from the screen, so they should match the tiles. If they don't, the data has changed since the panel loaded: refresh it.
- Treat suggestions as prompts, not decisions. The panel can say a channel looks strong; only your team knows whether there is room to spend more there. Decisions belong in the recommendations queue, where they are recorded.
- Watch the language around benchmarks. A summary may describe a return as strong. Whether it is strong for your vertical is a judgement for your team.
Questions teams ask
What is sent to the model?
The page's context, as structured data, with a short instruction; for the copilot, the same context plus your question. In the current build the model is reached through an OpenAI API key set on the server. Without a key, nothing is sent anywhere and the rule-based text is used.
What does the copilot do without a model?
It answers simply from the same context: questions about spend or budget get the spend, budget and utilisation figures; questions about ROAS or return get blended ROAS and revenue; questions about alerts get the active and critical counts. Anything else gets a short excerpt of the page data and a note that a model is needed for deeper analysis.
Is the summary saved?
No. It is generated when the panel loads and streamed in; refresh it to regenerate from the current records. If a decision follows from it, record that decision in the recommendations queue.
Can the panel be wrong?
The rule-based text quotes numbers directly, so it is as right as the data. A model can misread or over-interpret; that is why the numbers it quotes should always be checked against the tiles on the same screen.
Next: a creative team using fatigue scores and the overlap matrix.