Connected TV is where cross-channel measurement arguments usually start. The spots are expensive, almost nobody clicks a TV, and the sale shows up days later on a phone. Last-touch attribution gives CTV nothing; the CTV vendor's own report gives it everything. A measurement team needs a way to answer the question honestly. This guide sets out the three tools and how they fit together in InsightAdScale.
Use attribution to see how credit is shared among channels, a lift test to measure whether a channel causes extra conversions, and the identity graph to link the TV view to the later visit on another device. Report attribution weekly; settle disputes with lift.
Three questions, three tools
| Question | Tool | Where in InsightAdScale |
|---|---|---|
| How should credit for conversions be shared among channels? | Attribution models | Attribution: model picker, channel credit, funnel |
| Would these conversions have happened without the channel? | Lift (incrementality) test | Incrementality & Lift: lift tests |
| Which later visits belong to the household that saw the ad? | Identity graph, cross-device matching | Identity Graph; CTV-to-digital mapping |
| How does each channel's return change as spend grows? | Media mix model | Incrementality & Lift: media mix model tab |
Step 1: see the attribution spread
Start on the Attribution screen and switch between models. Note CTV's share under last touch, first touch and data driven. A wide spread is the signal that CTV's value depends on your assumptions, and that a lift test is worth running. The CTV-to-digital mapping further down shows how many CTV views were followed by visits on mobile, desktop and tablet, and the cross-device match rate behind those links. See the six models compared.
Step 2: design the lift test
A lift test splits the eligible audience at random before the flight. The treatment group sees the ads; the control group is held out. Compare conversion rates at the end. The difference, as a share of the control rate, is the lift, and a confidence figure says how likely it is that chance alone produced it.
- Decide the metric first. Site visits, sign-ups or purchases, written down before the flight.
- Size the control group to the effect you hope to see. Small effects need large groups. Holding out a quarter of the audience is common for CTV; your data team should size it for your conversion rate.
- Run it long enough. CTV's effect arrives late; a test that ends the day the flight ends will miss it.
- Don't peek and stop. Stopping the moment a result looks significant inflates false positives.
Worked example: the arithmetic of lift
All figures here are made up. A CTV flight's eligible audience is 80,000 households, split at random: 60,000 in treatment, 20,000 held out as control. Over the test window, 1,380 treatment households book (2.3%) and 400 control households book (2.0%).
| Measure | How it is worked out | Result |
|---|---|---|
| Lift | (2.3% − 2.0%) ÷ 2.0% | 15% |
| Incremental bookings | (2.3% − 2.0%) × 60,000 treatment households | 180 |
| Cost per incremental booking | Flight spend of $90,000 ÷ 180 | $500 |
The last line is the one that settles budget arguments. Last-touch reporting might credit CTV with almost none of the 1,380 bookings; the vendor's report might claim most of them. The test says about 180 would not have happened without the flight, and that is the number to set against what a booking is worth. The confidence figure says how far to trust it: with a small control group, the same 0.3-point gap could easily be noise.
Step 3: read the results
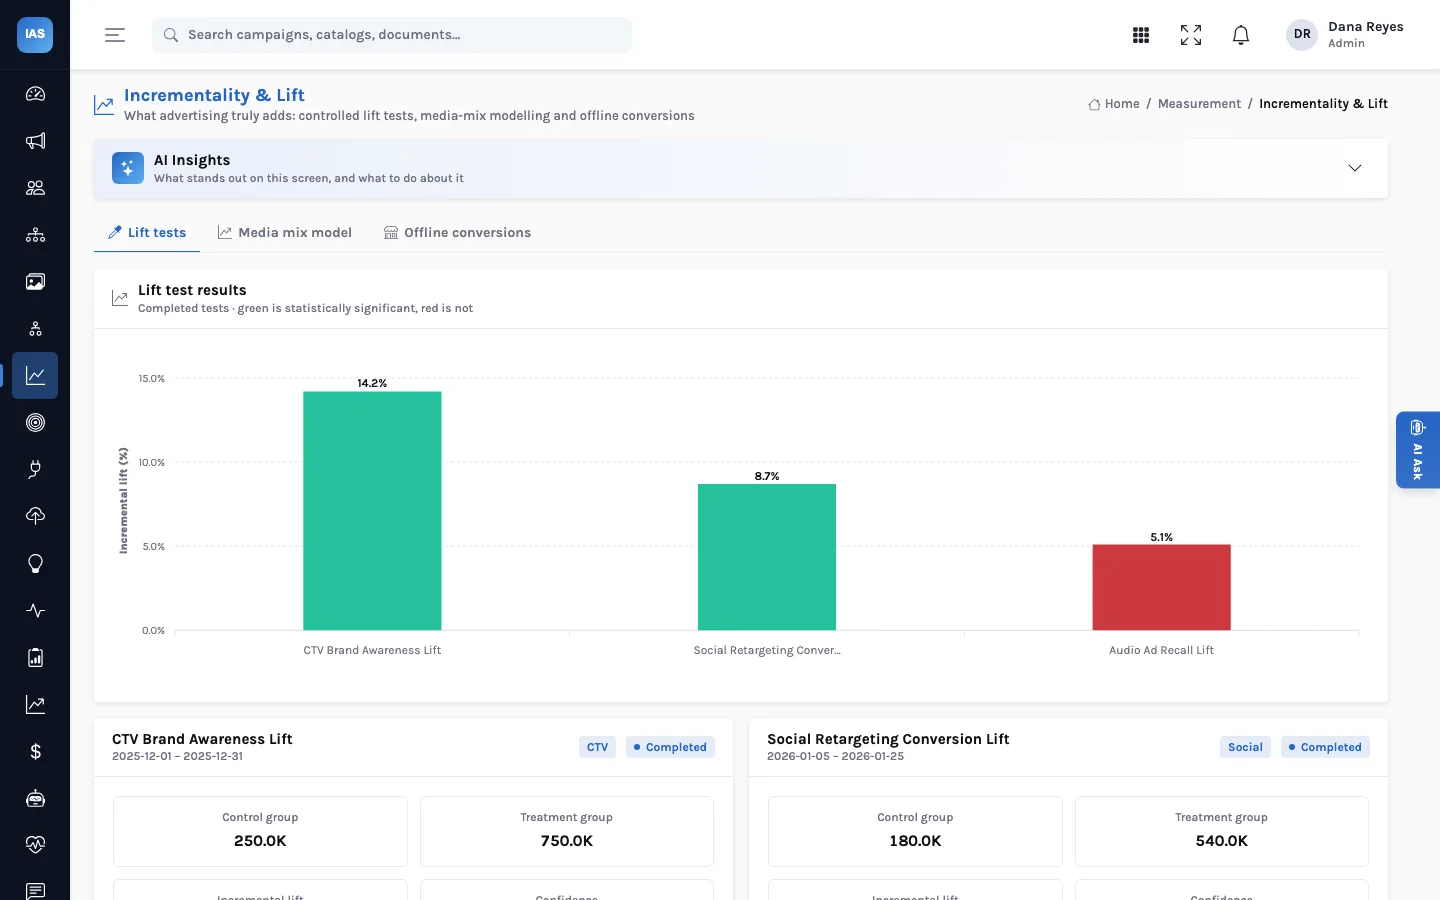
The Incrementality & Lift screen lists tests with their channel, dates, status, control and treatment sizes, lift and confidence. The chart colours completed tests green when the result is statistically significant and red when it is not. Other tabs hold the media mix model (each channel's contribution and where returns start to diminish) and offline conversions, with their match rate.
Step 4: link the devices
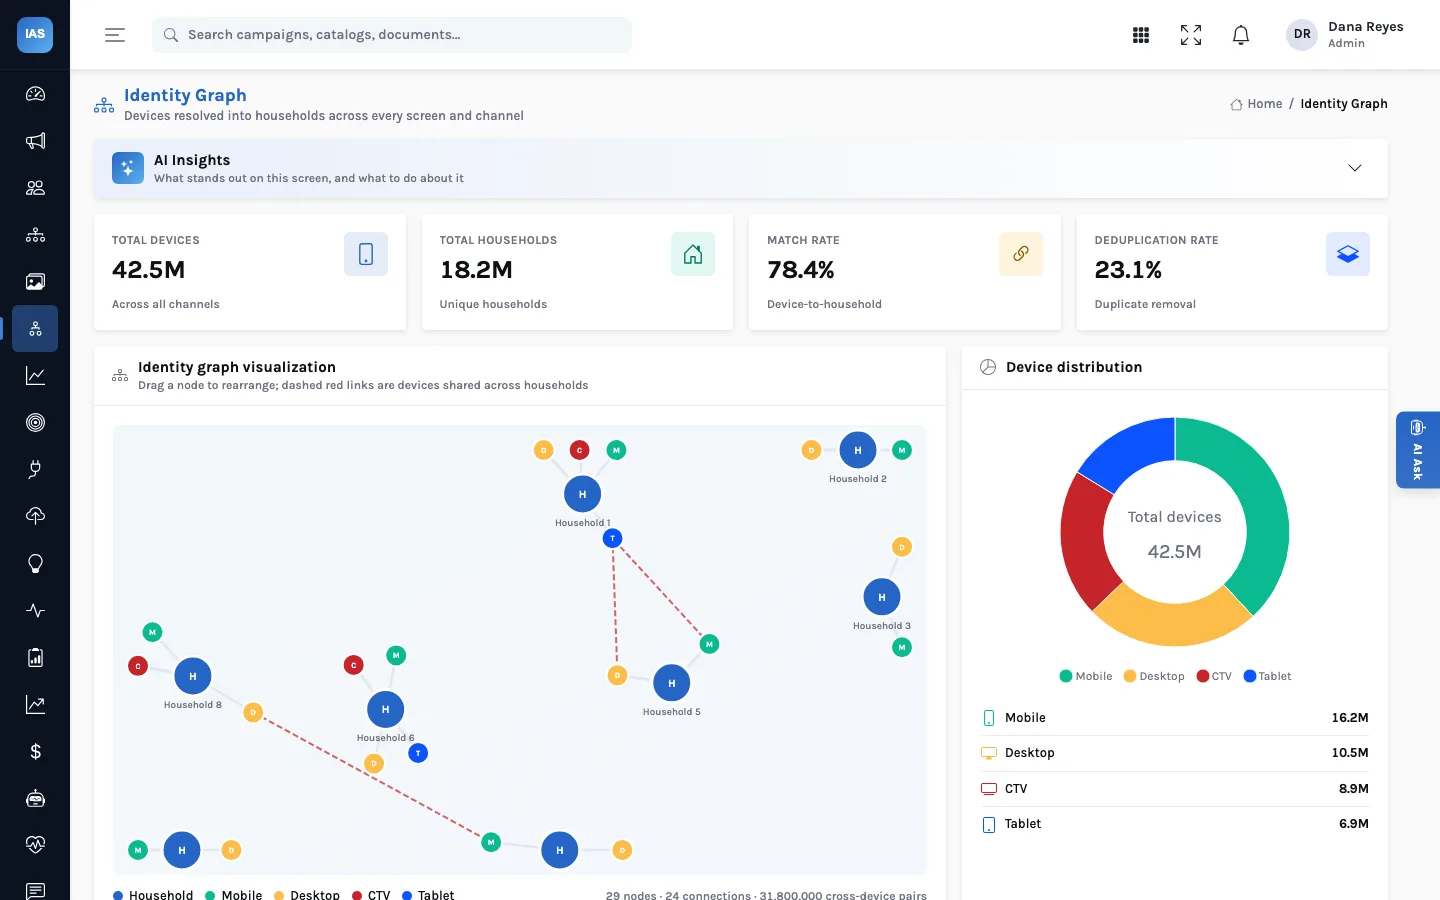
The Identity Graph resolves devices into households across every screen and channel: total devices, unique households, device-to-household match rate and the share of duplicates removed. Its visualisation draws households with their devices, mobile, desktop, CTV and tablet, and the cross-device links between them. A higher match rate means more of the TV views can be tied to what happened next, and so more honest credit for CTV in every attribution model.
Bluecove Travel settles the CTV question
Bluecove Travel (fictional) spends a large share of its winter budget on CTV. Last-touch reporting gives it almost no credit; the data-driven view gives it a fair share. Its analyst, Tom, runs a four-week holdout test, sized with the data team and with bookings as the metric written down in advance. The result is significant. From then on Bluecove reports weekly on its data-driven model, quotes the lift result when CTV's budget is questioned, and plans a re-test next season, because one test is evidence, not a permanent answer.
Pitfalls that sink a test
- Contaminated control. If the control group still sees the brand's CTV through another buy, the gap shrinks and CTV looks weaker than it is. Check every buy that reaches the same households.
- Changing two things at once. A price promotion launched mid-test lifts both groups and muddies the result. Freeze other changes, or at least note them.
- Reading one test as permanent. Creative, season and audience all change the answer. Re-test when any of them changes materially.
- Matching too little. A low cross-device or offline match rate means many conversions cannot be tied to either group. Look at the match rate before the result.
Questions measurement teams ask
Does InsightAdScale run the test for us?
No. The split, the holdout and the conversion matching happen in your ad platform or measurement partner. InsightAdScale is where the results sit next to attribution and the rest of the portfolio; in the current build the screen shows sample tests.
Is a media mix model a substitute for lift tests?
They answer different questions. The media mix model tab shows modelled weekly contribution by channel, diminishing returns as spend moves from 10% to 200% of today's level, and a suggested allocation. A lift test is the experiment that checks one channel's effect directly. Teams that use both calibrate the model with test results.
What about offline sales?
The offline conversions tab is for CRM, point-of-sale and call-centre events matched back to ad exposure: the match rate for each source and the offline conversions credited to each channel. It matters because a CTV campaign for a retailer often pays off in stores.
What to report, and when
- Weekly: one agreed attribution model, the same every week.
- Per quarter: lift results for the channels whose value is disputed, with confidence and test dates.
- Once or twice a year: a media mix view of where each channel's returns start to diminish, to plan budgets.
This is general guidance on measurement practice; have your analytics team design and size any test for your data.