A customer sees your connected-TV spot, clicks a social ad a week later, scrolls past a display banner, and finally searches for your brand and buys. Which channel earned the sale? Every attribution model is a different answer to that question, and none of them is the truth. Knowing what each one assumes is how you stop arguing about the number and start using it.
Rule-based models (last touch, first touch, linear, time decay, position based) apply a fixed rule to every journey. A data-driven model learns the split from your own paths. InsightAdScale shows each channel's conversions, revenue and credit under whichever model you pick, so you can see where the models agree and where they don't.
The six models
| Model | The rule | Assumes | Tends to favour |
|---|---|---|---|
| Last touch | All credit to the final interaction | The closer did the work | Search, retargeting |
| First touch | All credit to the first interaction | Discovery is what matters | CTV, video, display |
| Linear | Equal shares to every touch | Every touch helped equally | Channels with many touches |
| Time decay | More credit the closer to the sale | Recent touches matter more | Lower-funnel channels |
| Position based | 40% first, 40% last, 20% shared in between | Opening and closing both matter | The ends of the journey |
| Data driven | Credit learned from converting and non-converting paths | Your data can show what changes the odds | Depends on your data |
Two cautions apply to all of them. First, every model shares out credit for conversions that happened, so none of them says whether a conversion would have happened anyway; that is what incrementality testing is for. Second, a model can only credit touches it can see. A CTV impression that cannot be tied to the later visit gets no credit under any rule, which is why cross-device matching matters.
Worked example: one order, five rules
Put a value on the journey in the diagram. Say the purchase on day 15 is a made-up $600 order. Under each rule-based model the $600 is shared like this (time decay with a seven-day half-life, rounded to the dollar):
| Model | CTV (day 1) | Social (day 8) | Display (day 12) | Search (day 14) |
|---|---|---|---|---|
| Last touch | $0 | $0 | $0 | $600 |
| First touch | $600 | $0 | $0 | $0 |
| Linear | $150 | $150 | $150 | $150 |
| Time decay | $62 | $125 | $186 | $227 |
| Position based | $240 | $60 | $60 | $240 |
The time-decay figures come from weighting each touch by one half for every seven days between it and the purchase: 14 days for the CTV view gives a weight of 0.25, 7 days for the social click 0.5, 3 days for the display view about 0.74 and 1 day for the search click about 0.91. Each touch's share is its weight divided by the total. Nothing about the customer changed between rows; only the rule did. CTV's credit for the same order runs from nothing to all of it.
Across a real portfolio the same thing happens thousands of times, and the per-channel totals on the Attribution screen are the sum. That is why a channel's number only means something next to the name of the model that produced it.
Reading it in InsightAdScale
On the Attribution screen, the model picker at the top switches every panel at once. The Channel credit breakdown lists, for each channel, its attributed conversions, attributed revenue and share of the model's credit; the chart beside it draws the same shares. Change the model and watch which channels move.
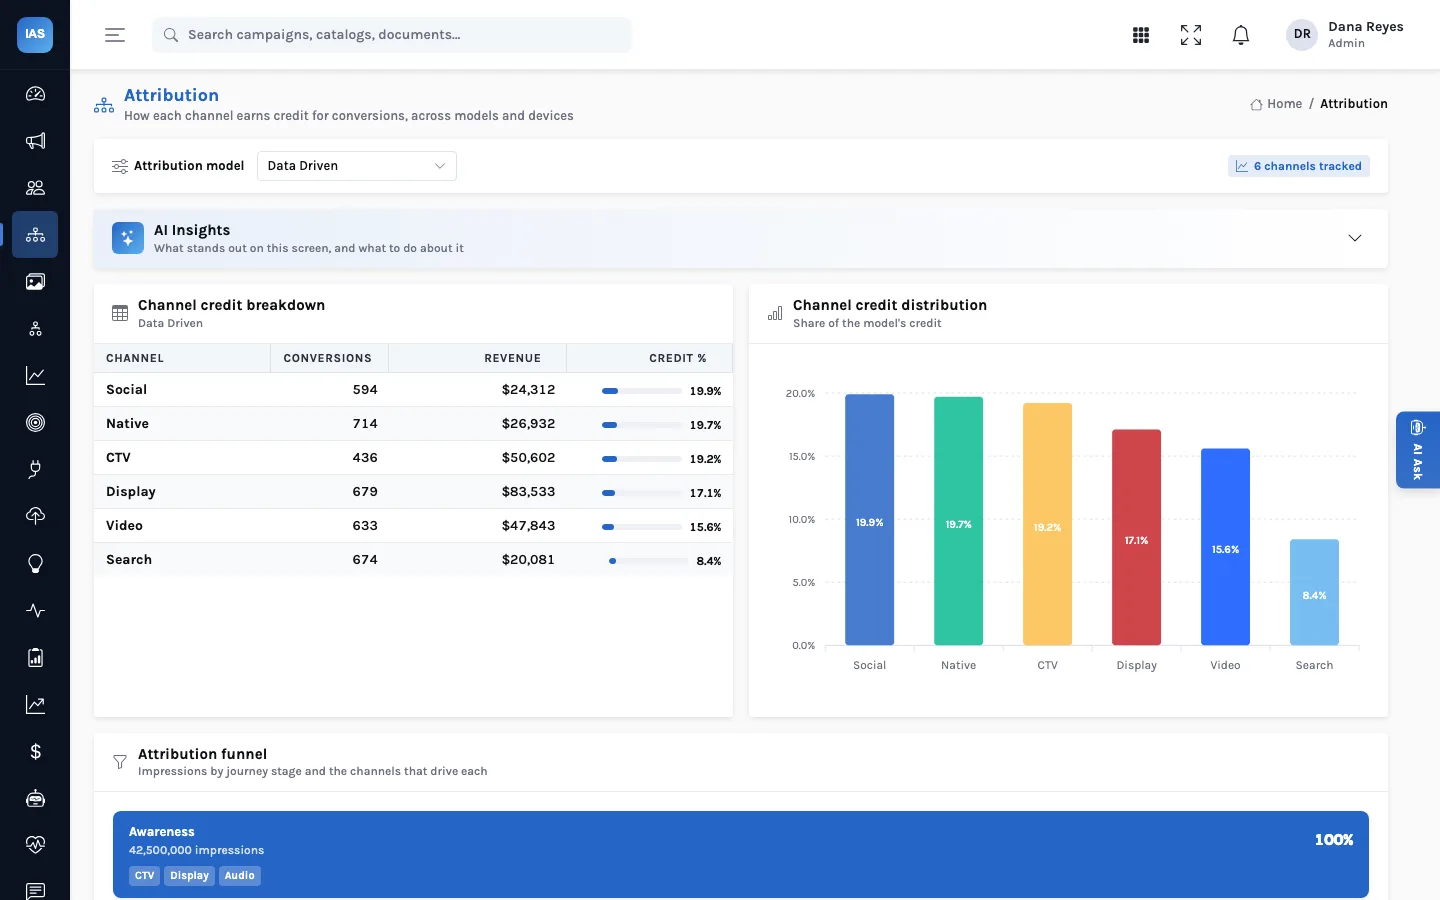
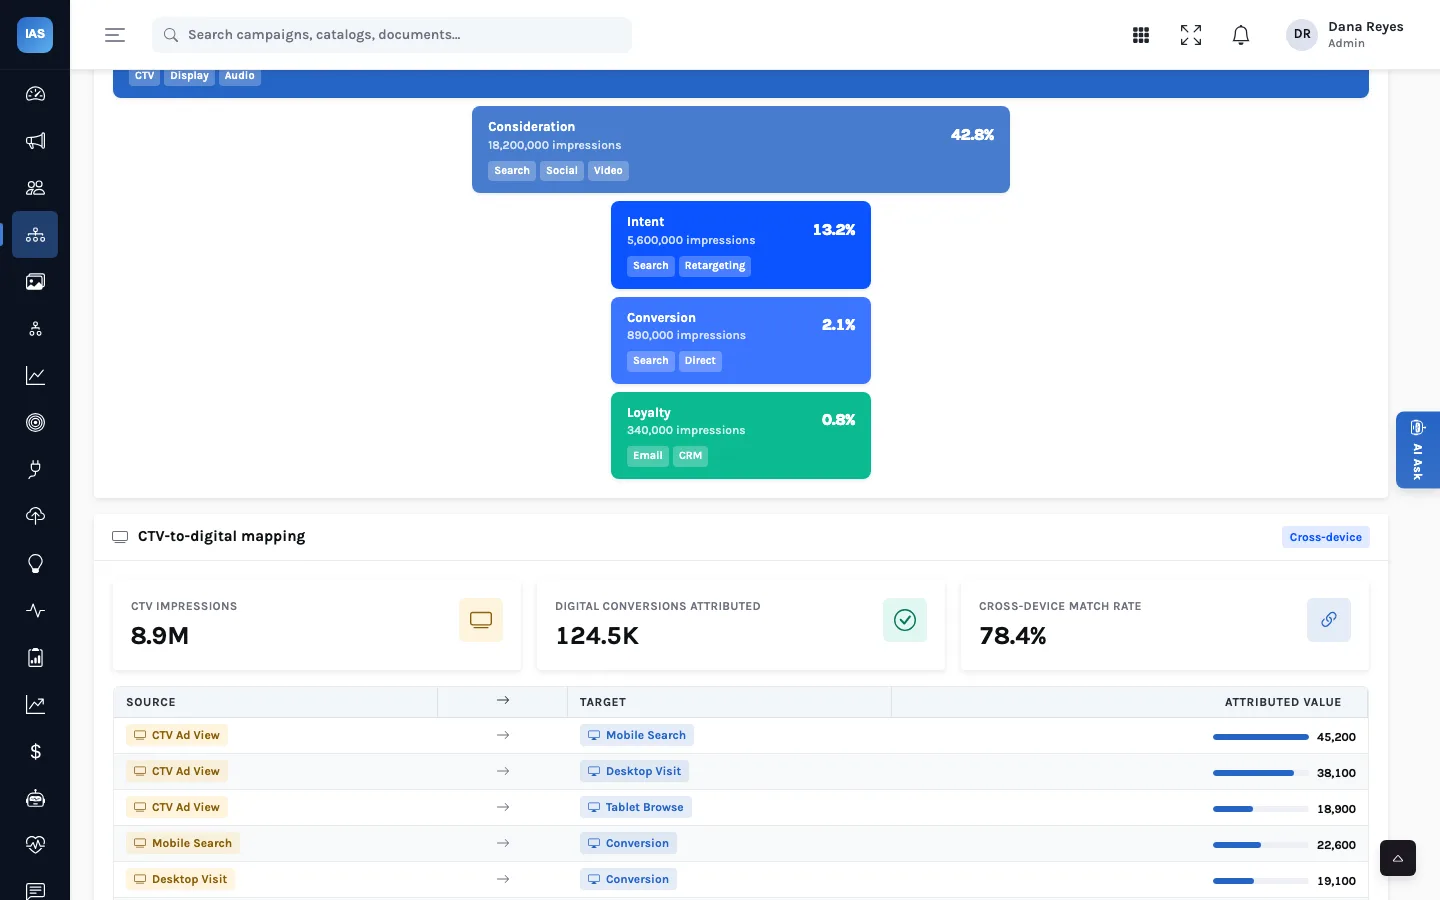
Further down, the Attribution funnel lays out impressions by journey stage (awareness, consideration, intent, conversion, loyalty) and the channels that drive each stage. The CTV-to-digital mapping follows connected-TV views to the mobile, desktop and tablet visits that came after, with the cross-device match rate that makes those links possible. In the current build these two panels show built-in sample figures; the channel credit breakdown above them reads your loaded results.
Choosing a model, practically
- Pick one model for reporting and stick to it. Switching the reporting model mid-quarter makes every trend line meaningless. Use the others to explore.
- Look at the spread, not just the number. If a channel's share barely moves between first touch and last touch, its credit is robust. If it swings from 5% to 40%, its value depends on your assumptions, and it is a good candidate for a lift test.
- Match the model to the objective. An awareness flight judged on last touch will always look poor. Judge it on reach and lift, or at least on a position-based or data-driven view.
- Keep data-driven honest. A learned model needs enough converting and non-converting paths to be stable. On a small advertiser or a new channel, a rule-based model is easier to explain and harder to over-fit.
What you load, and what the screen does with it
Each attribution result is a record tied to a campaign, with the model type, the channel credited, the credit value, attributed conversions and attributed revenue, plus optional fields for the conversion ID and the touchpoints in the path. The screen sums conversions, revenue and credit by channel for the selected model, and the model picker lists the model types present in your data. In practice that means:
| If you… | You will see… |
|---|---|
| Load only last-touch results | One model in the picker; the others cannot be compared yet |
| Load the same conversions under several models | A like-for-like comparison: switch models and the totals stay the same while credit moves |
| Load models for different periods | Totals that differ between models for reasons that have nothing to do with the rules; avoid this |
| Spell a channel two ways | Two rows for one channel; agree channel names before loading |
A quick spread check
- Pick the period and the channels you report on.
- Note each channel's credit share under last touch and under first touch.
- Note it again under the model you report on.
- Mark any channel whose share moves by more than you would accept in a budget conversation. Your team sets that line.
- Those channels are the candidates for a lift test before their budget is cut or grown.
Questions analysts ask
Does InsightAdScale run the attribution models?
No. It stores and compares results produced by your attribution process, whether that is a vendor, a platform export or your own data science team. That keeps the numbers auditable: what is on screen is what was loaded.
Which model should leadership see?
One, agreed in advance and kept for the year, with a footnote naming it. Show the spread only when a decision depends on it.
Can data driven be compared with the rule-based models?
Yes, as long as it was run over the same conversions and period. It is often the most useful view and the hardest to explain, so keep a rule-based model alongside it.
Next: how a measurement team uses attribution, lift and identity together.